Here is a brief overview of the metrics and other values in the improvements table:
<aside> 🆔 Name - This is the name that the improvement owner has defined. It is supplemented by a short description (max. 200 characters) that you can find in the detailed view of the improvement.
</aside>
<aside> 📅 Start - This is the start date of the improvement and can be set in the past, present or future. End - This is the end date of the improvement and can be set in the present or future.
</aside>
<aside> 🤼 Team - This is the person or persons who are responsible for the improvement. The person creating the improvement doesn't have to be one of them. Please note that only the responsible people can edit or delete the improvement.
</aside>
<aside> 🖥️ Stations - These are the stations that have been included in the improvement and are used to track the stop reason data that the improvement targets.
</aside>
<aside> ❓ Stop reason - The production event - stop reason - that is being tracked.
</aside>
<aside> 🔢 Actions - Shows the completed project actions against the total amount of actions defined.
</aside>
<aside> 🎯 Baseline average - The daily average duration or count of the specified stop reason(s), calculated over the past 3 months (from start date) or based on your set period. Please note that statistics are gathered based on days that have at least 10 minutes of production. If the specific stop occurs, the data for that day is included whether there is 10 minutes of production or not.
</aside>
<aside> 📈 Current average - The daily average duration or count of the specified stop reason (s), calculated from the start of the project until today (today included). Please note that statistics are gathered based on days that have at least 10 minutes of production if the specific stop does not occur on that day. If the specific stop occurs, the data for that day is included whether there is 10 minutes of production or not.
</aside>
<aside> 📉 Change - The difference (percentage) of the baseline average and the current average. If the value is positive, the average duration or count has been reduced and the result is displayed in green. If the value is negative, the average duration or count has not reduced and the result is displayed in red.
</aside>
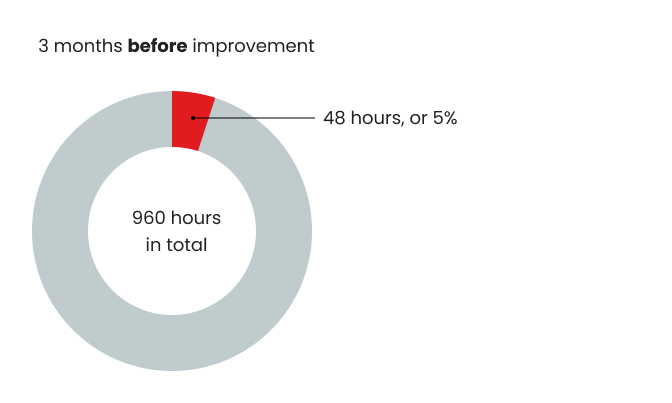
In the 3 months before the improvement start date, the scheduled production time was 960 hours (3 months x 20 working days per month x 16 hours per working day = 960 hours).
During that time the machine stopped for 48 hours in total due to the tracked stop reason (e.g. mechanical failure), which is 48/960*100 = 5% of the scheduled working time.
The improvement project started 1 month ago and the scheduled working time for that period is 320 hours (1-month x 20 working days per month x 16 hours per working day = 320 hours).
During that period the sum of the tracked stop reason was 10 hours. If the stop occurrence would have remained on the same level as before the start of the improvements, the machine would have been stopped for 16 hours (5% out of 320 hours = 16 hours).
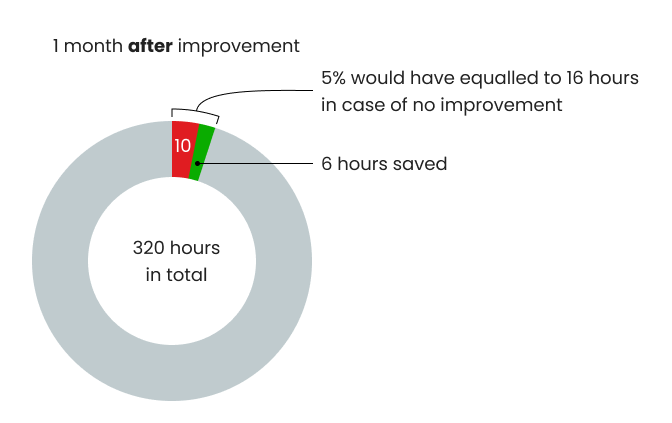
The difference between the two values 16-10 = 6 hours is the total time saved.